Quickstart
This guide walks you through signing up, deploying the Schnider Propofol anesthesia simulator, and running your first simulation with a PID controller. By the end of this tutorial you will be making controller changes informed by simulation results. This will be accomplished by walking you through the process of analyzing simulation results from the FluxSim PID controller. We will observe a key insight, which allows us to improve the aggregate loss of the full cohort with a simple change to setpoint.
1. Sign up
Go to app.fluxsim.io/signup. You can create an account with an email and password, or continue with Google. If you already have an account, head to app.fluxsim.io/login instead.
2. Deploy a simulator
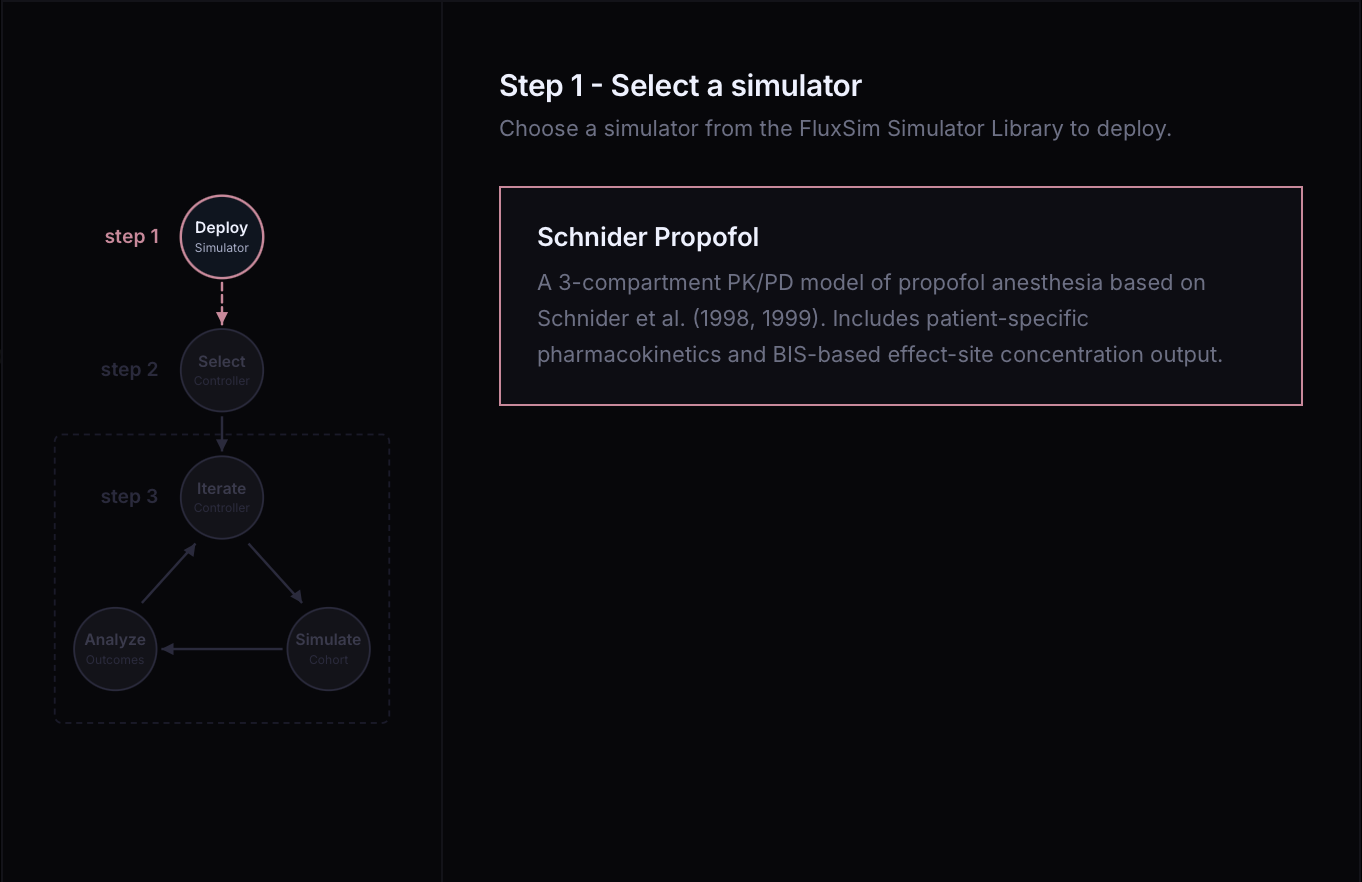
After logging in, a setup modal will appear. In Step 1, select Schnider Propofol from the FluxSim Simulator Library. The simulator is deployed automatically when you make your selection.
3. Select a controller
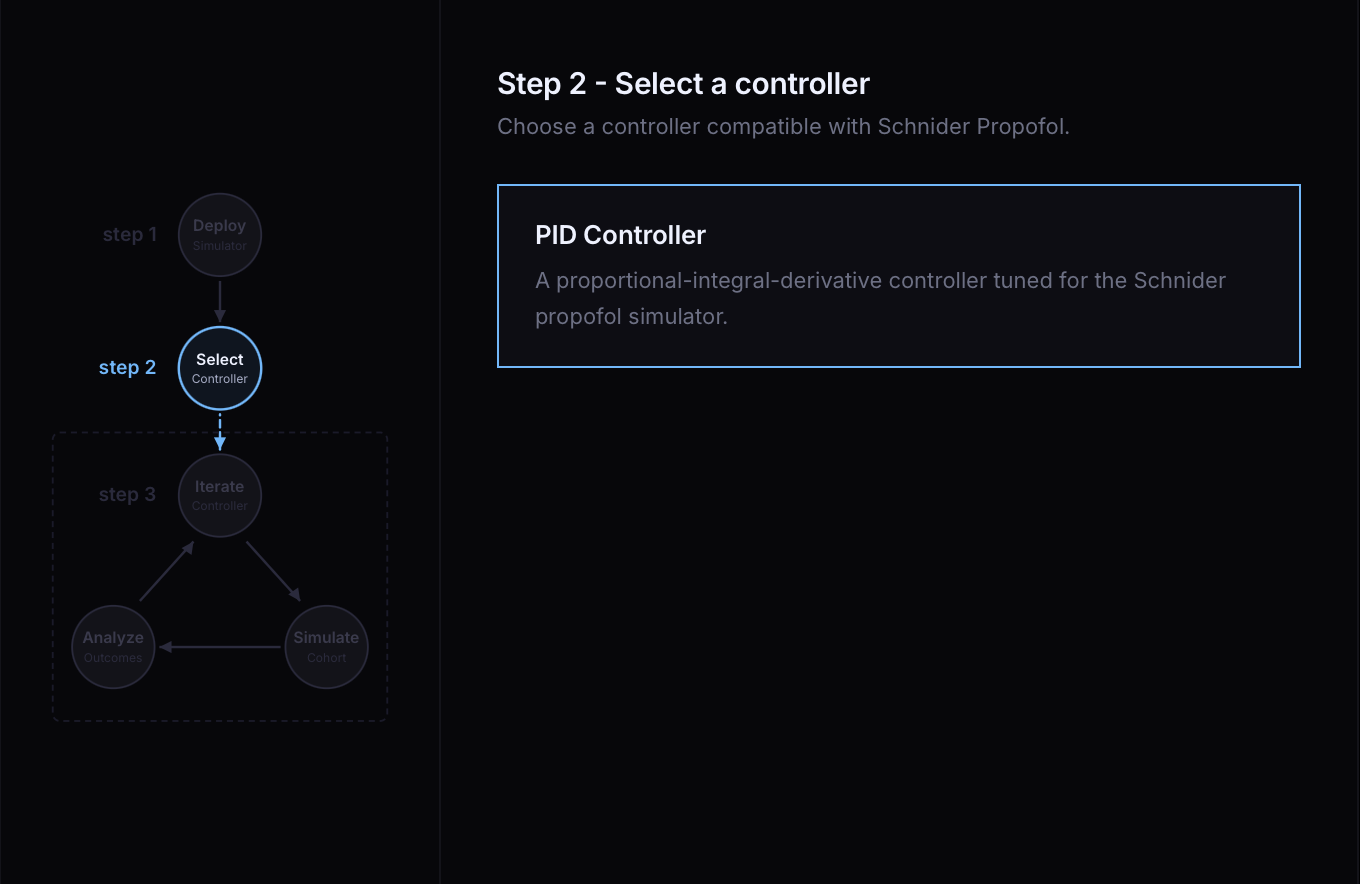
The modal advances to Step 2. Select PID Controller from the FluxSim Controller Library. This creates your controller project and opens it in the IDE.
4. Run a simulation
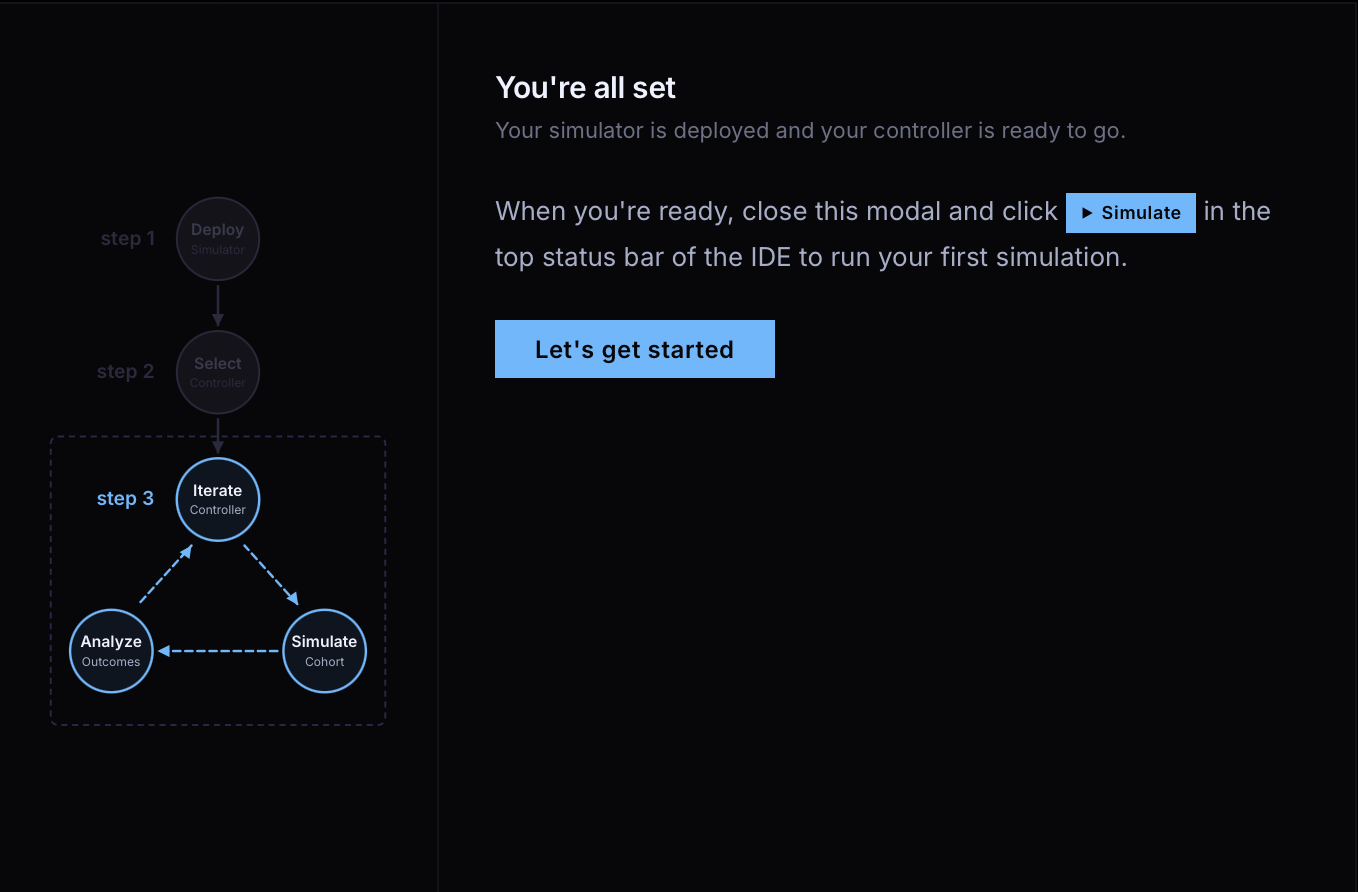
The modal will confirm your setup is complete and give you a chance to review before entering the IDE. Once you close it, your controller file is already open. Click Simulate in the top bar of the IDE to run your first simulation.
5. Read the results
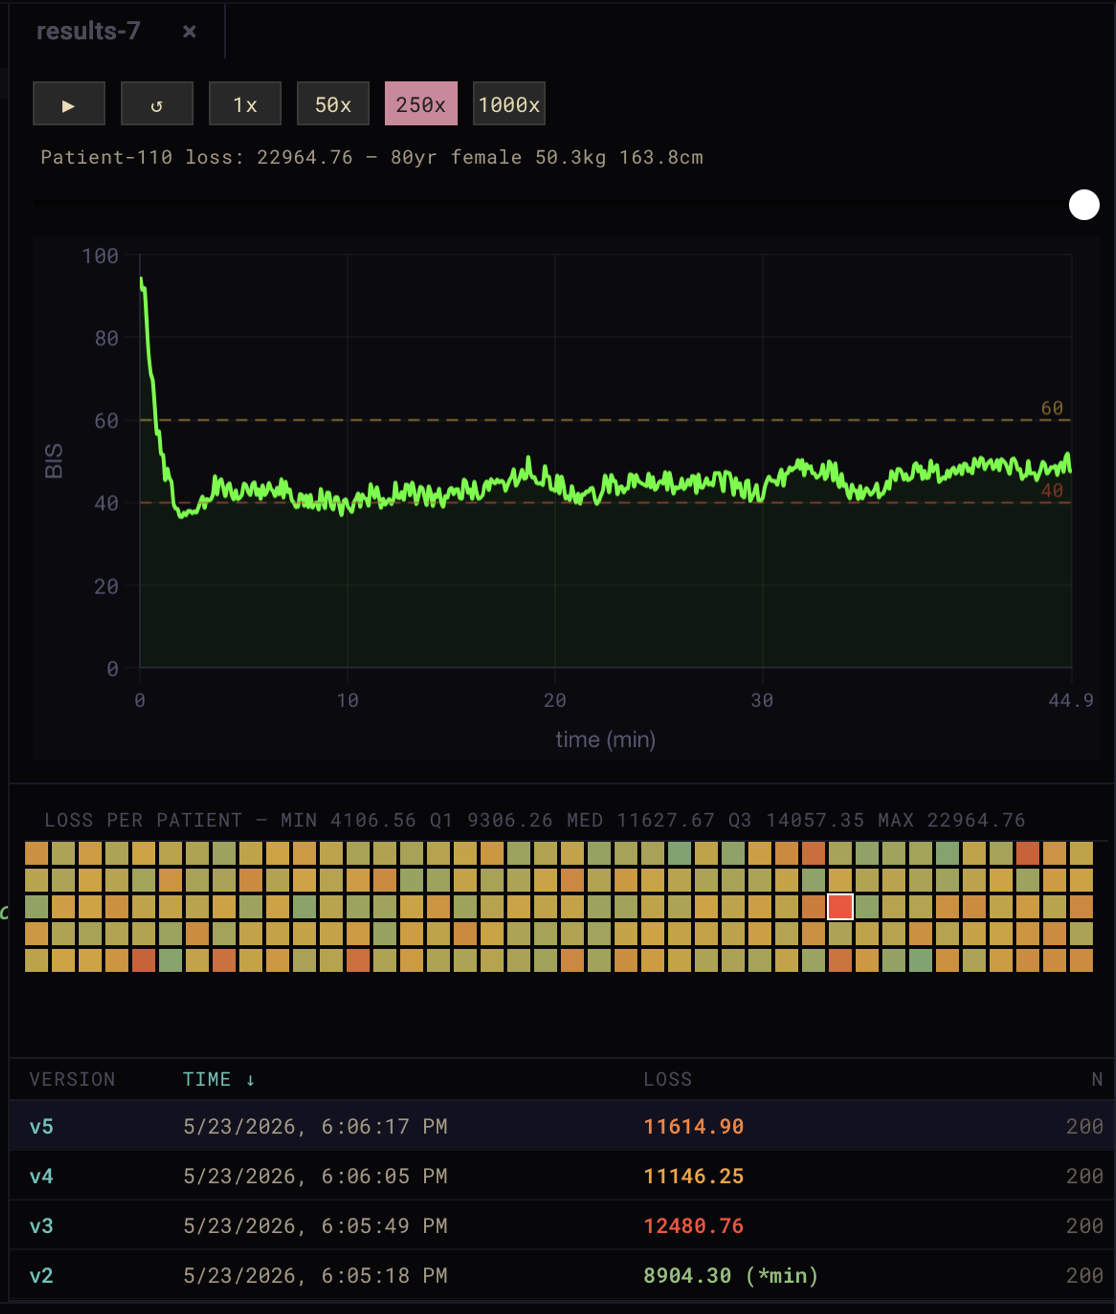
Results appear automatically in the right pane. The patient heatmap shows per-patient loss across the cohort — click any cell to load that patient's trace in the panel above. The run history table at the bottom tracks every simulation you've run, sortable by time or loss.
6. Improve the controller
With your first results in, press Cmd+A (Mac) or Ctrl+A (Windows) on the heatmap to select all 200 patients. The trace panel updates to show all patient traces overlaid.
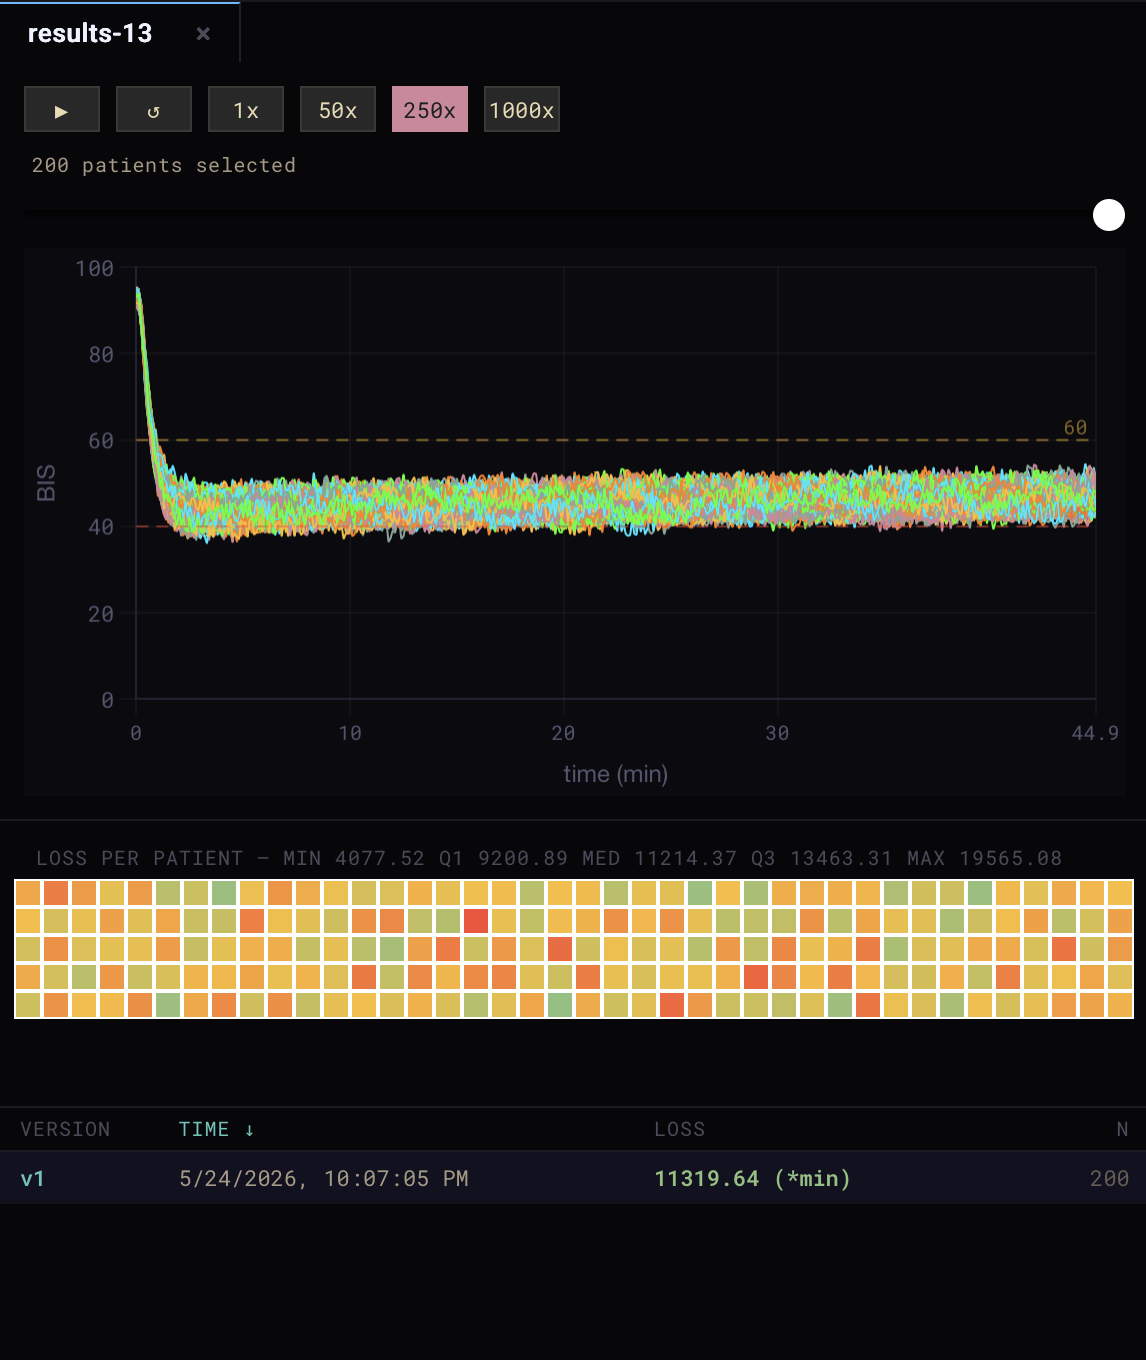
Notice that the traces settle below 50 and hug the lower dashed line at 40. The BIS target range is 40-60. Ideally the controller keeps patients centered around 50. The out-of-the-box PID setpoint is tuned too low.
The Schnider Propofol simulator uses a squared-error loss function that penalizes time spent outside the 40-60 BIS range. The further a patient's BIS deviates from the range, the higher the per-patient loss. Simulator loss function docs →
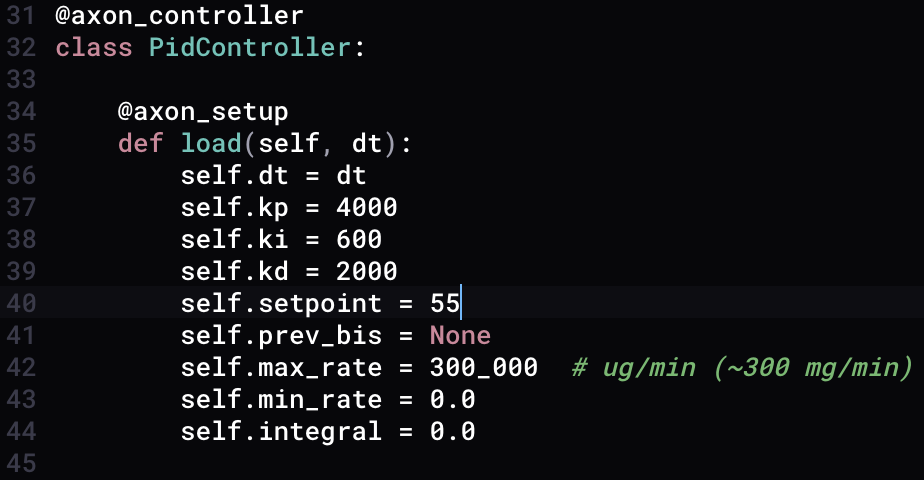
Open pid_controller.py and find the self.setpoint parameter in the load method. Change it from 50 to 55.
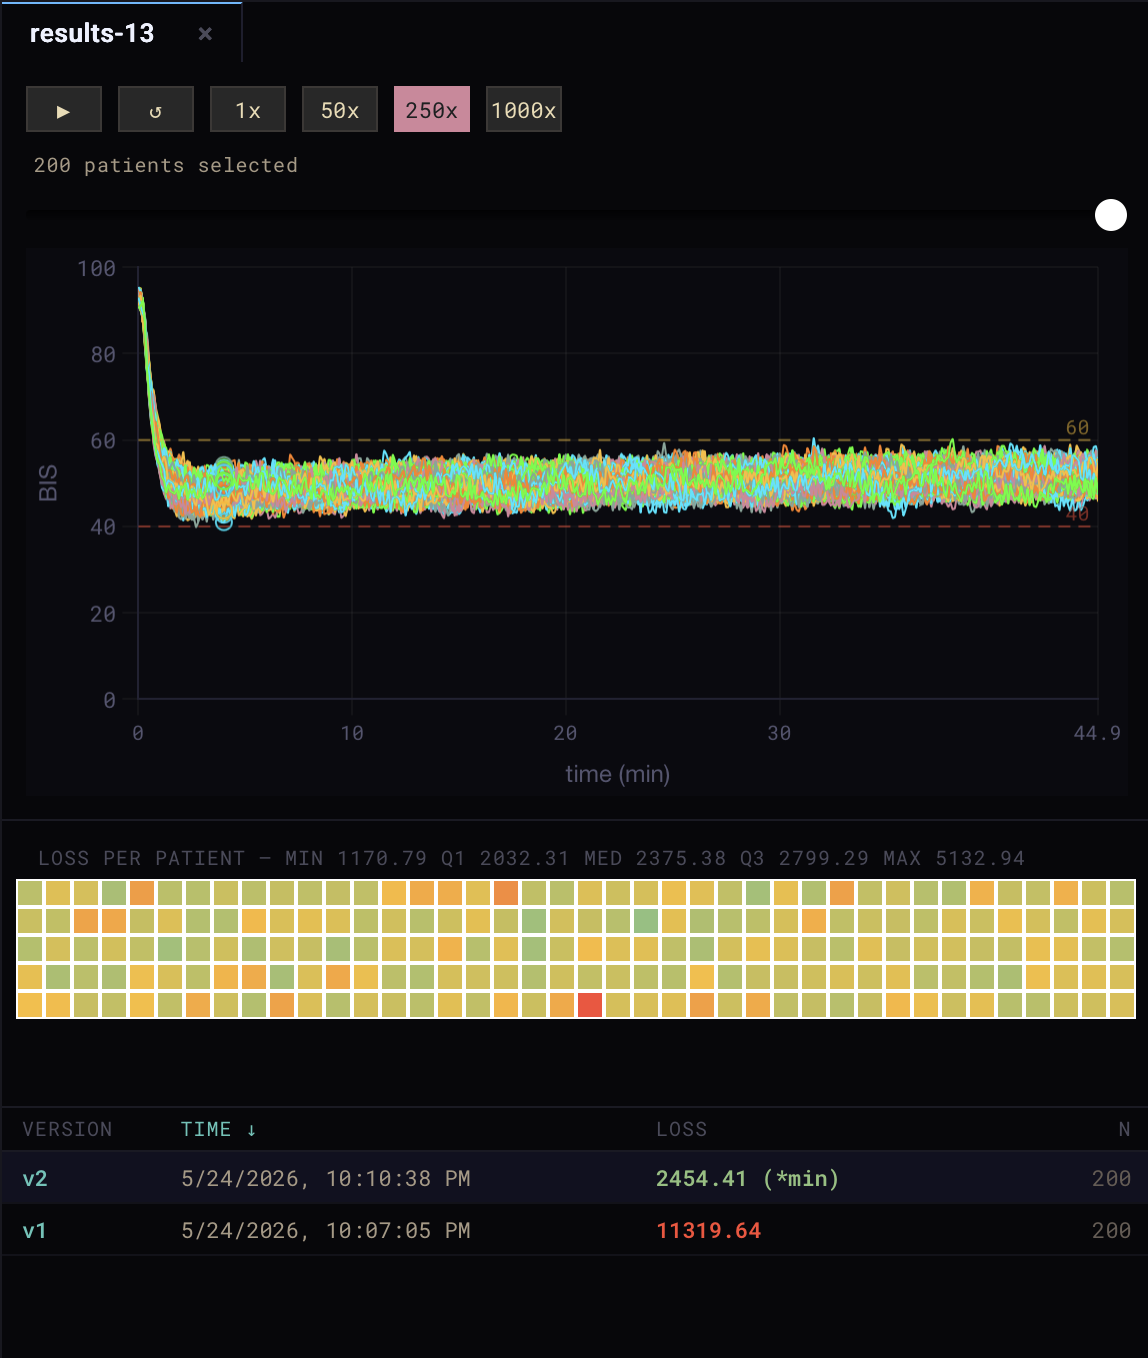
Click Simulate again. Select all patients and compare the traces — they now sit centered in the 40-60 range. Check the run history table: v2 loss dropped from 11319.64 to 2454.41.
Analysis
This simple improvement reveals something significant about the nature of tuning physiological closed-loop controllers. The setpoint and the PID gains do not exist in a vacuum. The out-of-the-box gains drive BIS to a steady-state below 50 even though the setpoint was set to 50, revealing an implicit bias toward overshoot. We can co-adapt the setpoint to compensate. By raising it to 55, we correct for the bias and achieve a steady-state BIS centered at 50.
This is a pattern you will encounter often in PCLC development. Simulation gives you the visibility to catch these interactions early, before they matter in a clinical setting.